~/writing/load-average-seven-hour-heartbeat
The load average with a seven hour heartbeat
Every seven hours the router's load average hit 1.0 for forty five minutes. CPU was 98% idle. Nothing ran, nothing blocked, nothing was stolen. The culprit was a beat frequency between two five second clocks, and one of them was mine.
My router is a VyOS VM, and its load average has a heartbeat. Every seven hours, load climbs to 1.0, holds it for forty five minutes, and drops back to 0.06. Grafana draws it as a row of mesas, drifting backward about seventy minutes a day.
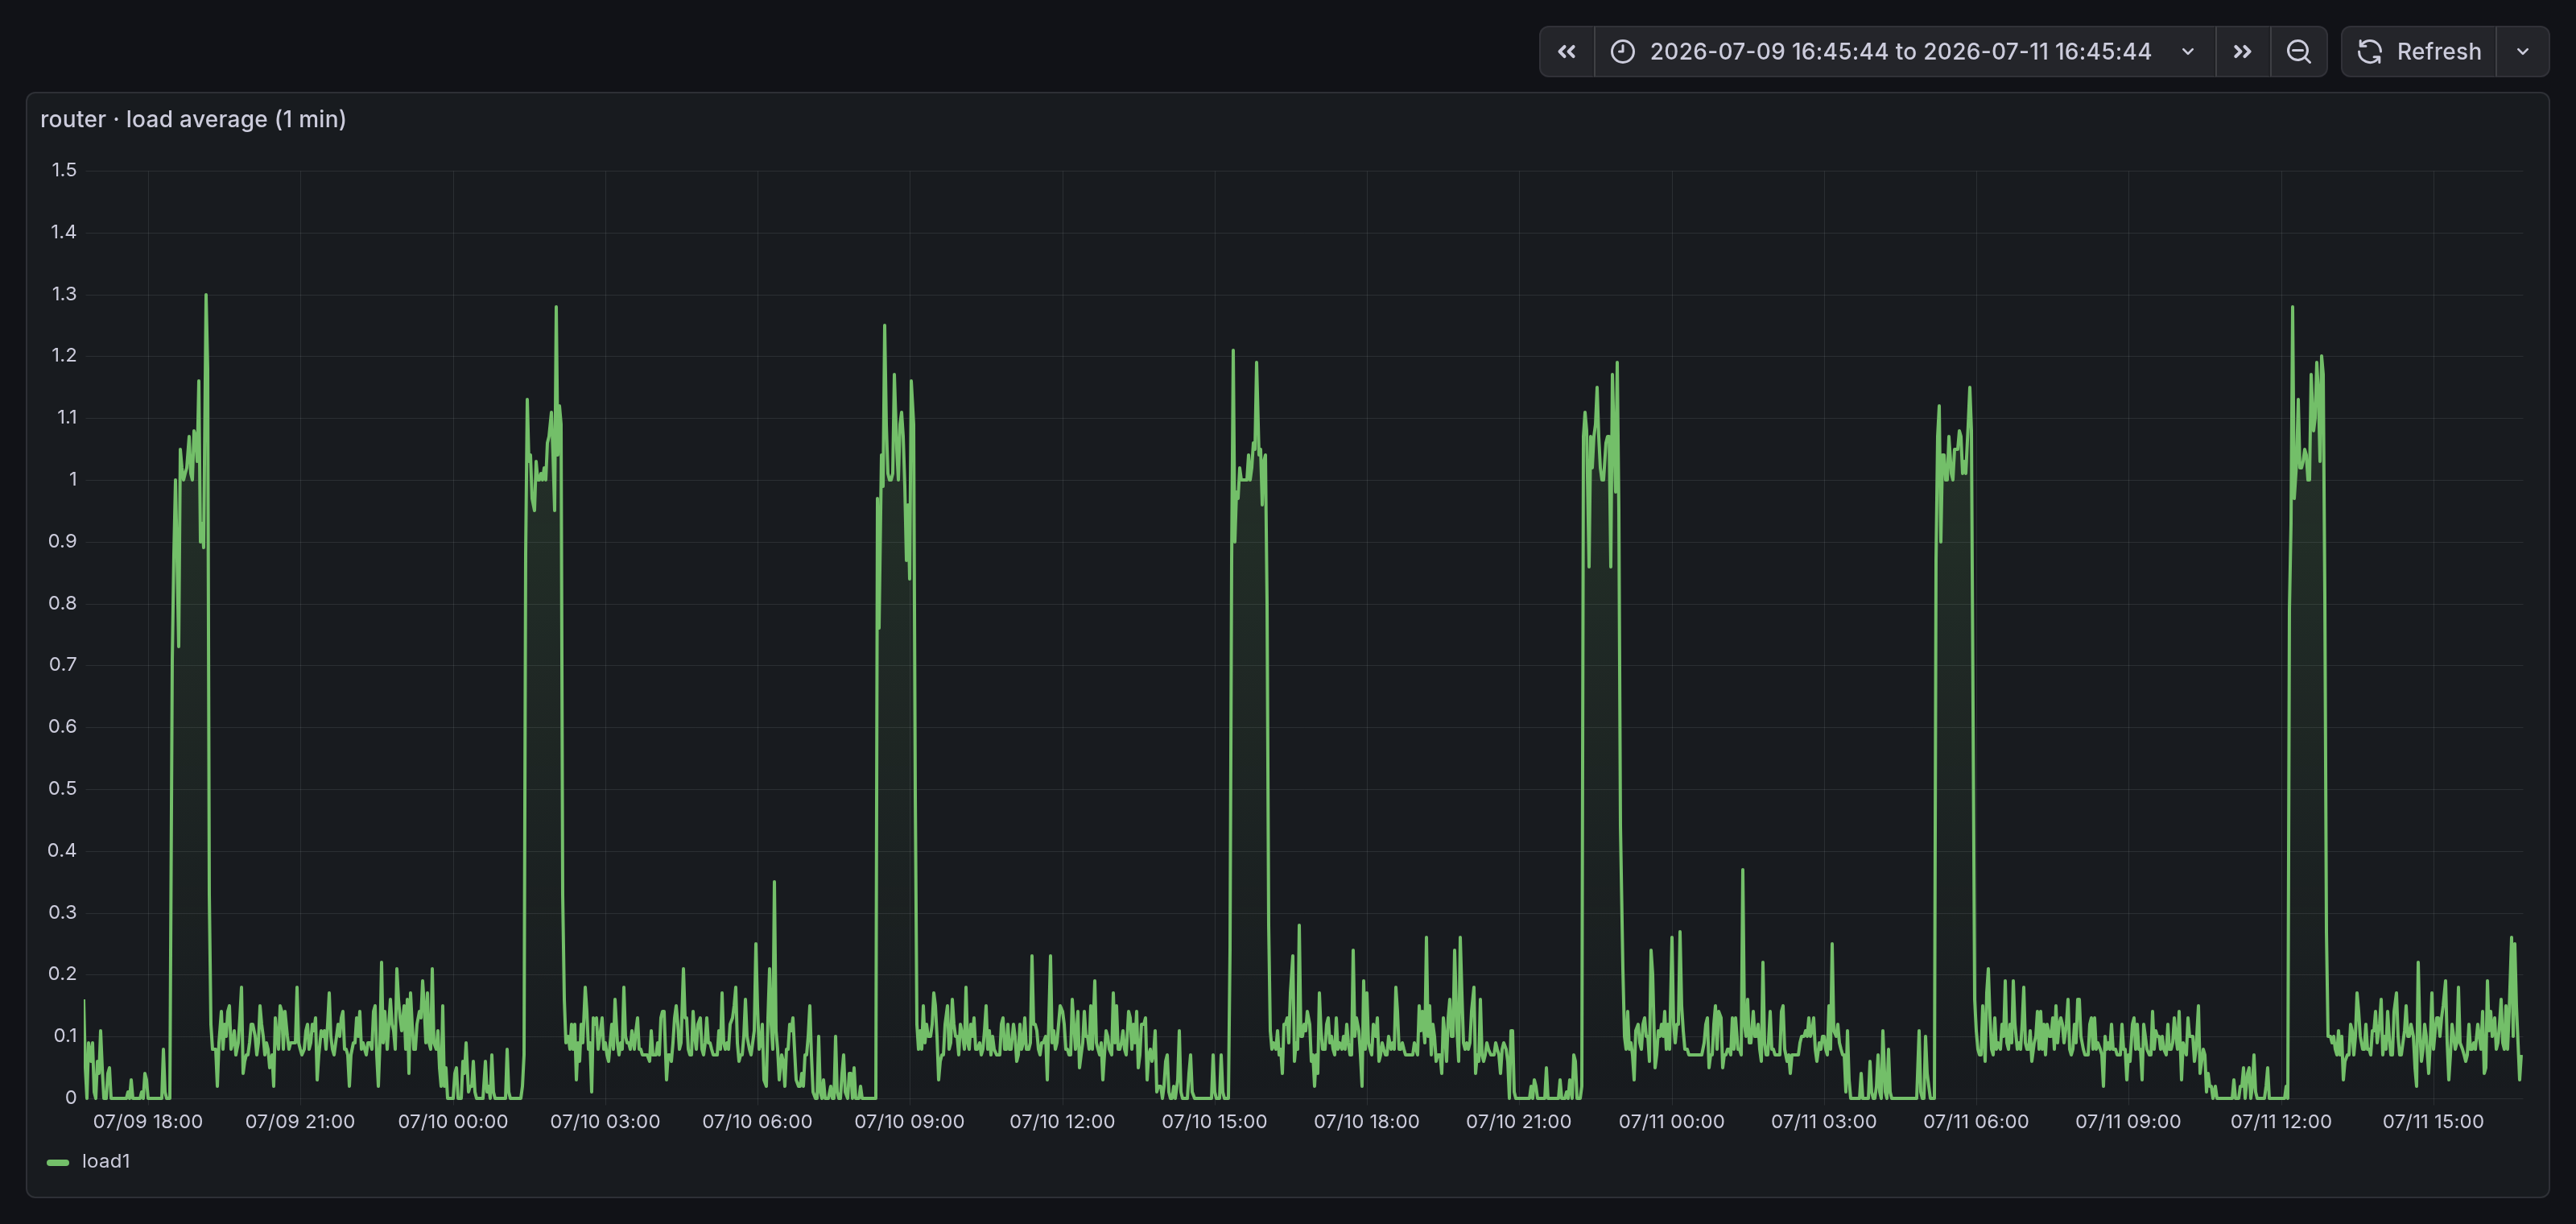
Load 1.0 is one core of work. I went looking for the work.
There is no work
No systemd timer or cron job runs on a seven hour cadence, and those fire at wall clock times anyway: these drift. API polling in front of the router is a constant 840 requests per hour, mesa or not.
CPU: 98% idle through every window. iowait: zero. D state, the classic load-without-CPU explanation: the kernel’s blocked-task counter reads zero the whole time. atop’s process accounting catches even short-lived processes: nothing above a few CPU-seconds. Steal from the hypervisor peaks at 0.093%, and the host’s backup jobs run at fixed clock times.
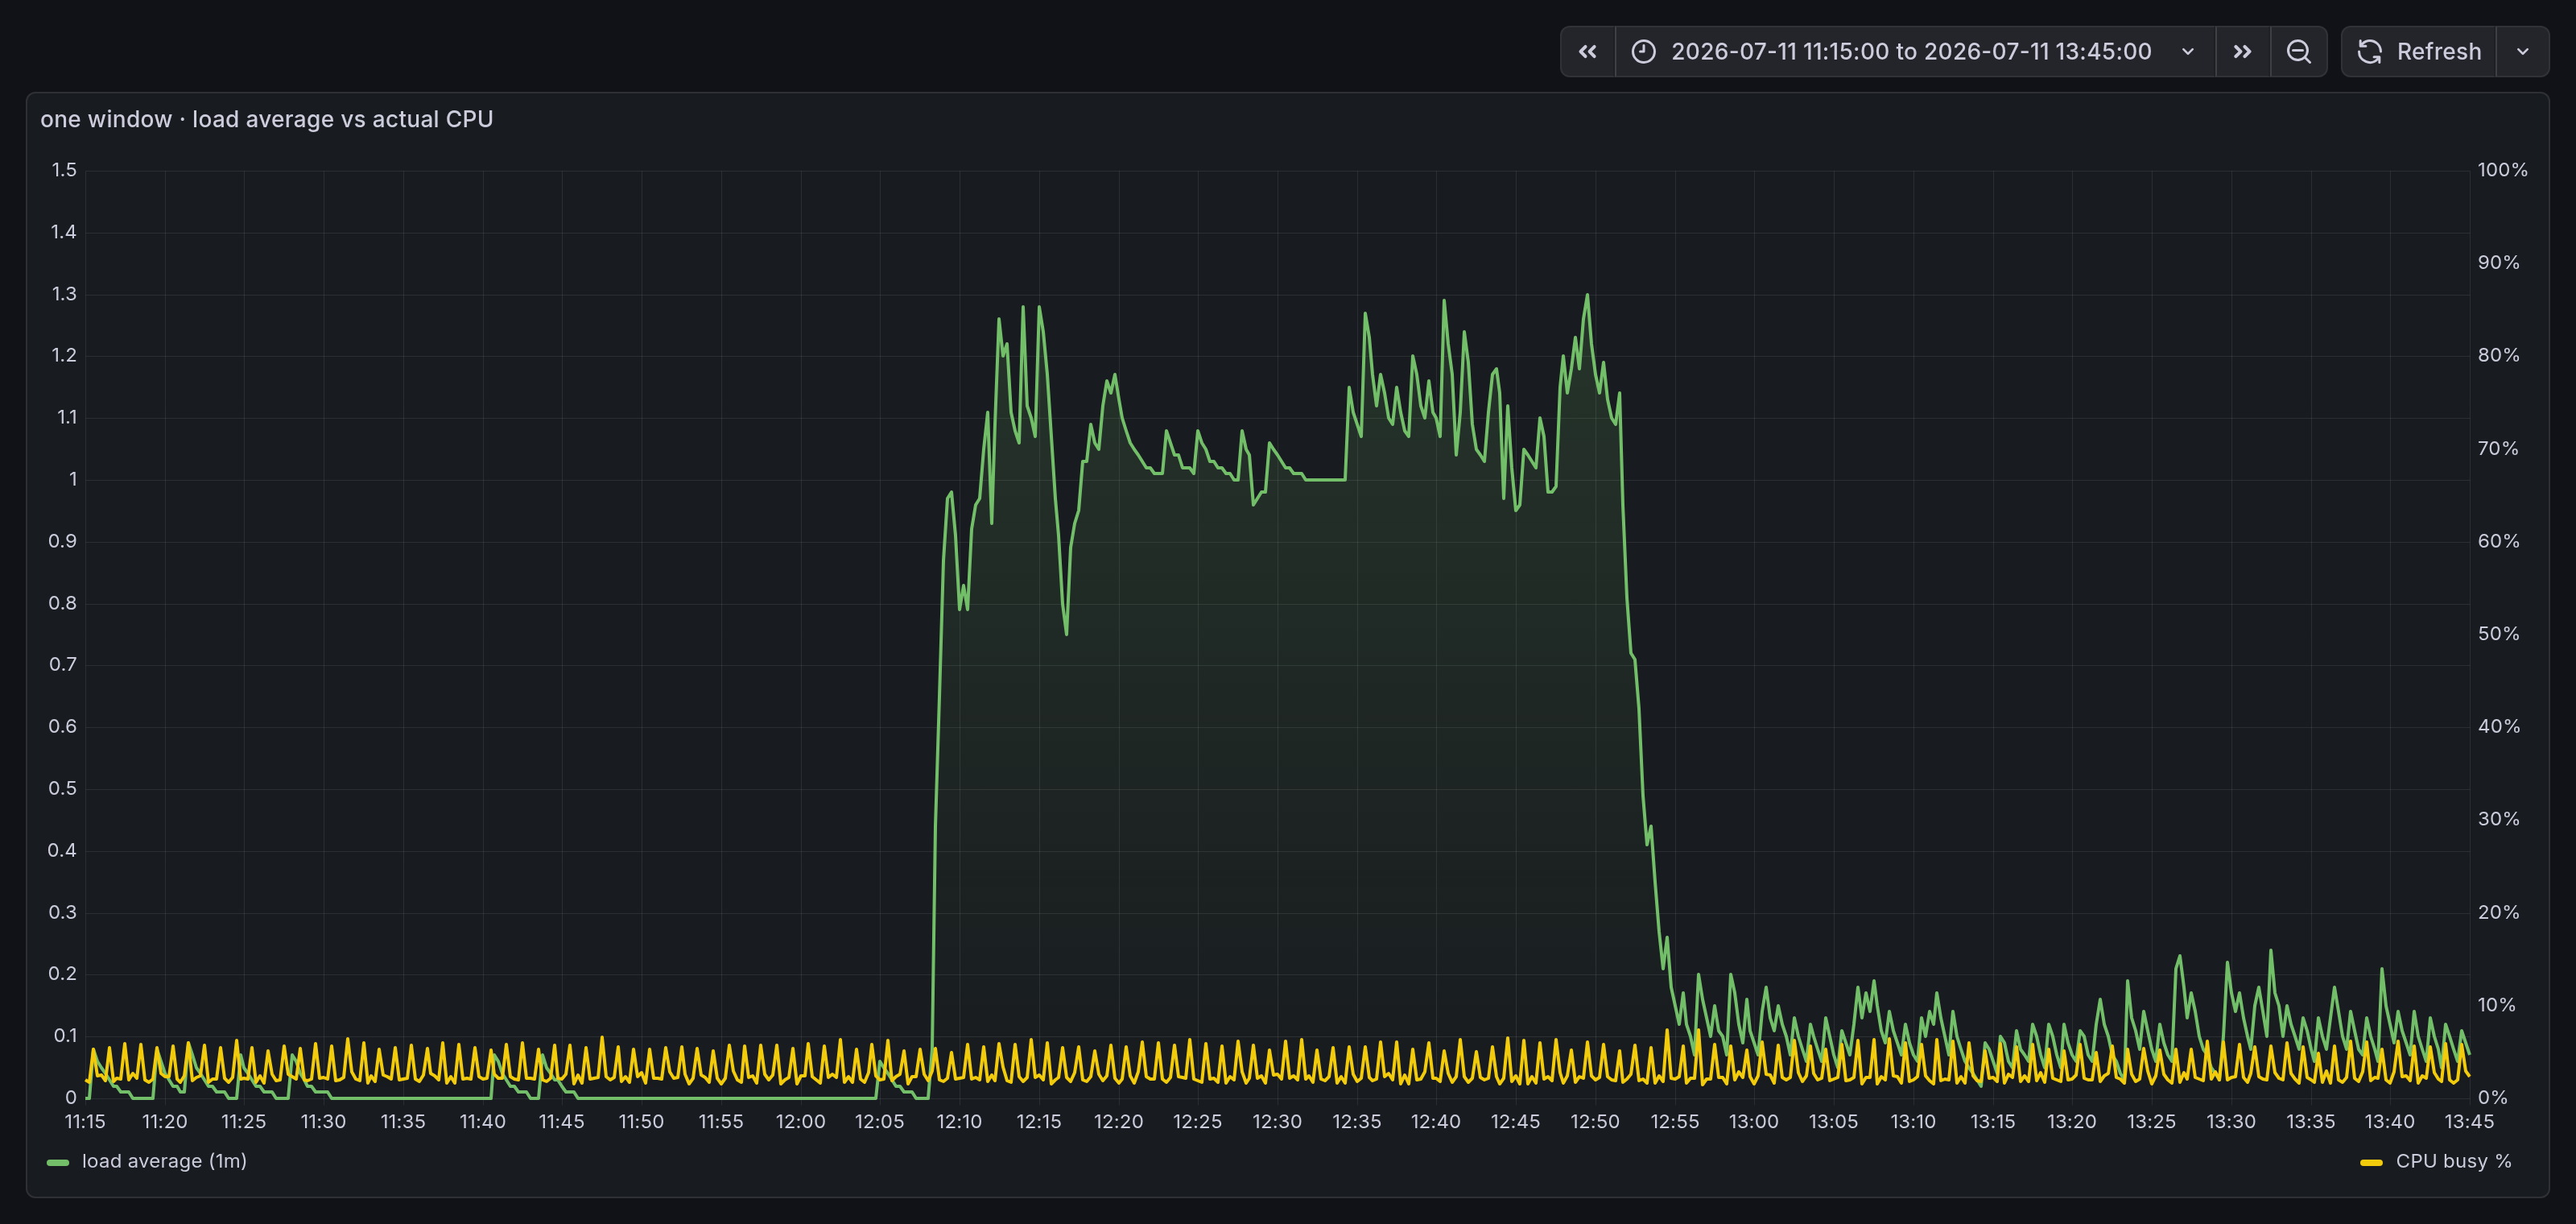
It also predates everything: same mesas before the last power outage, through reboots and config changes.
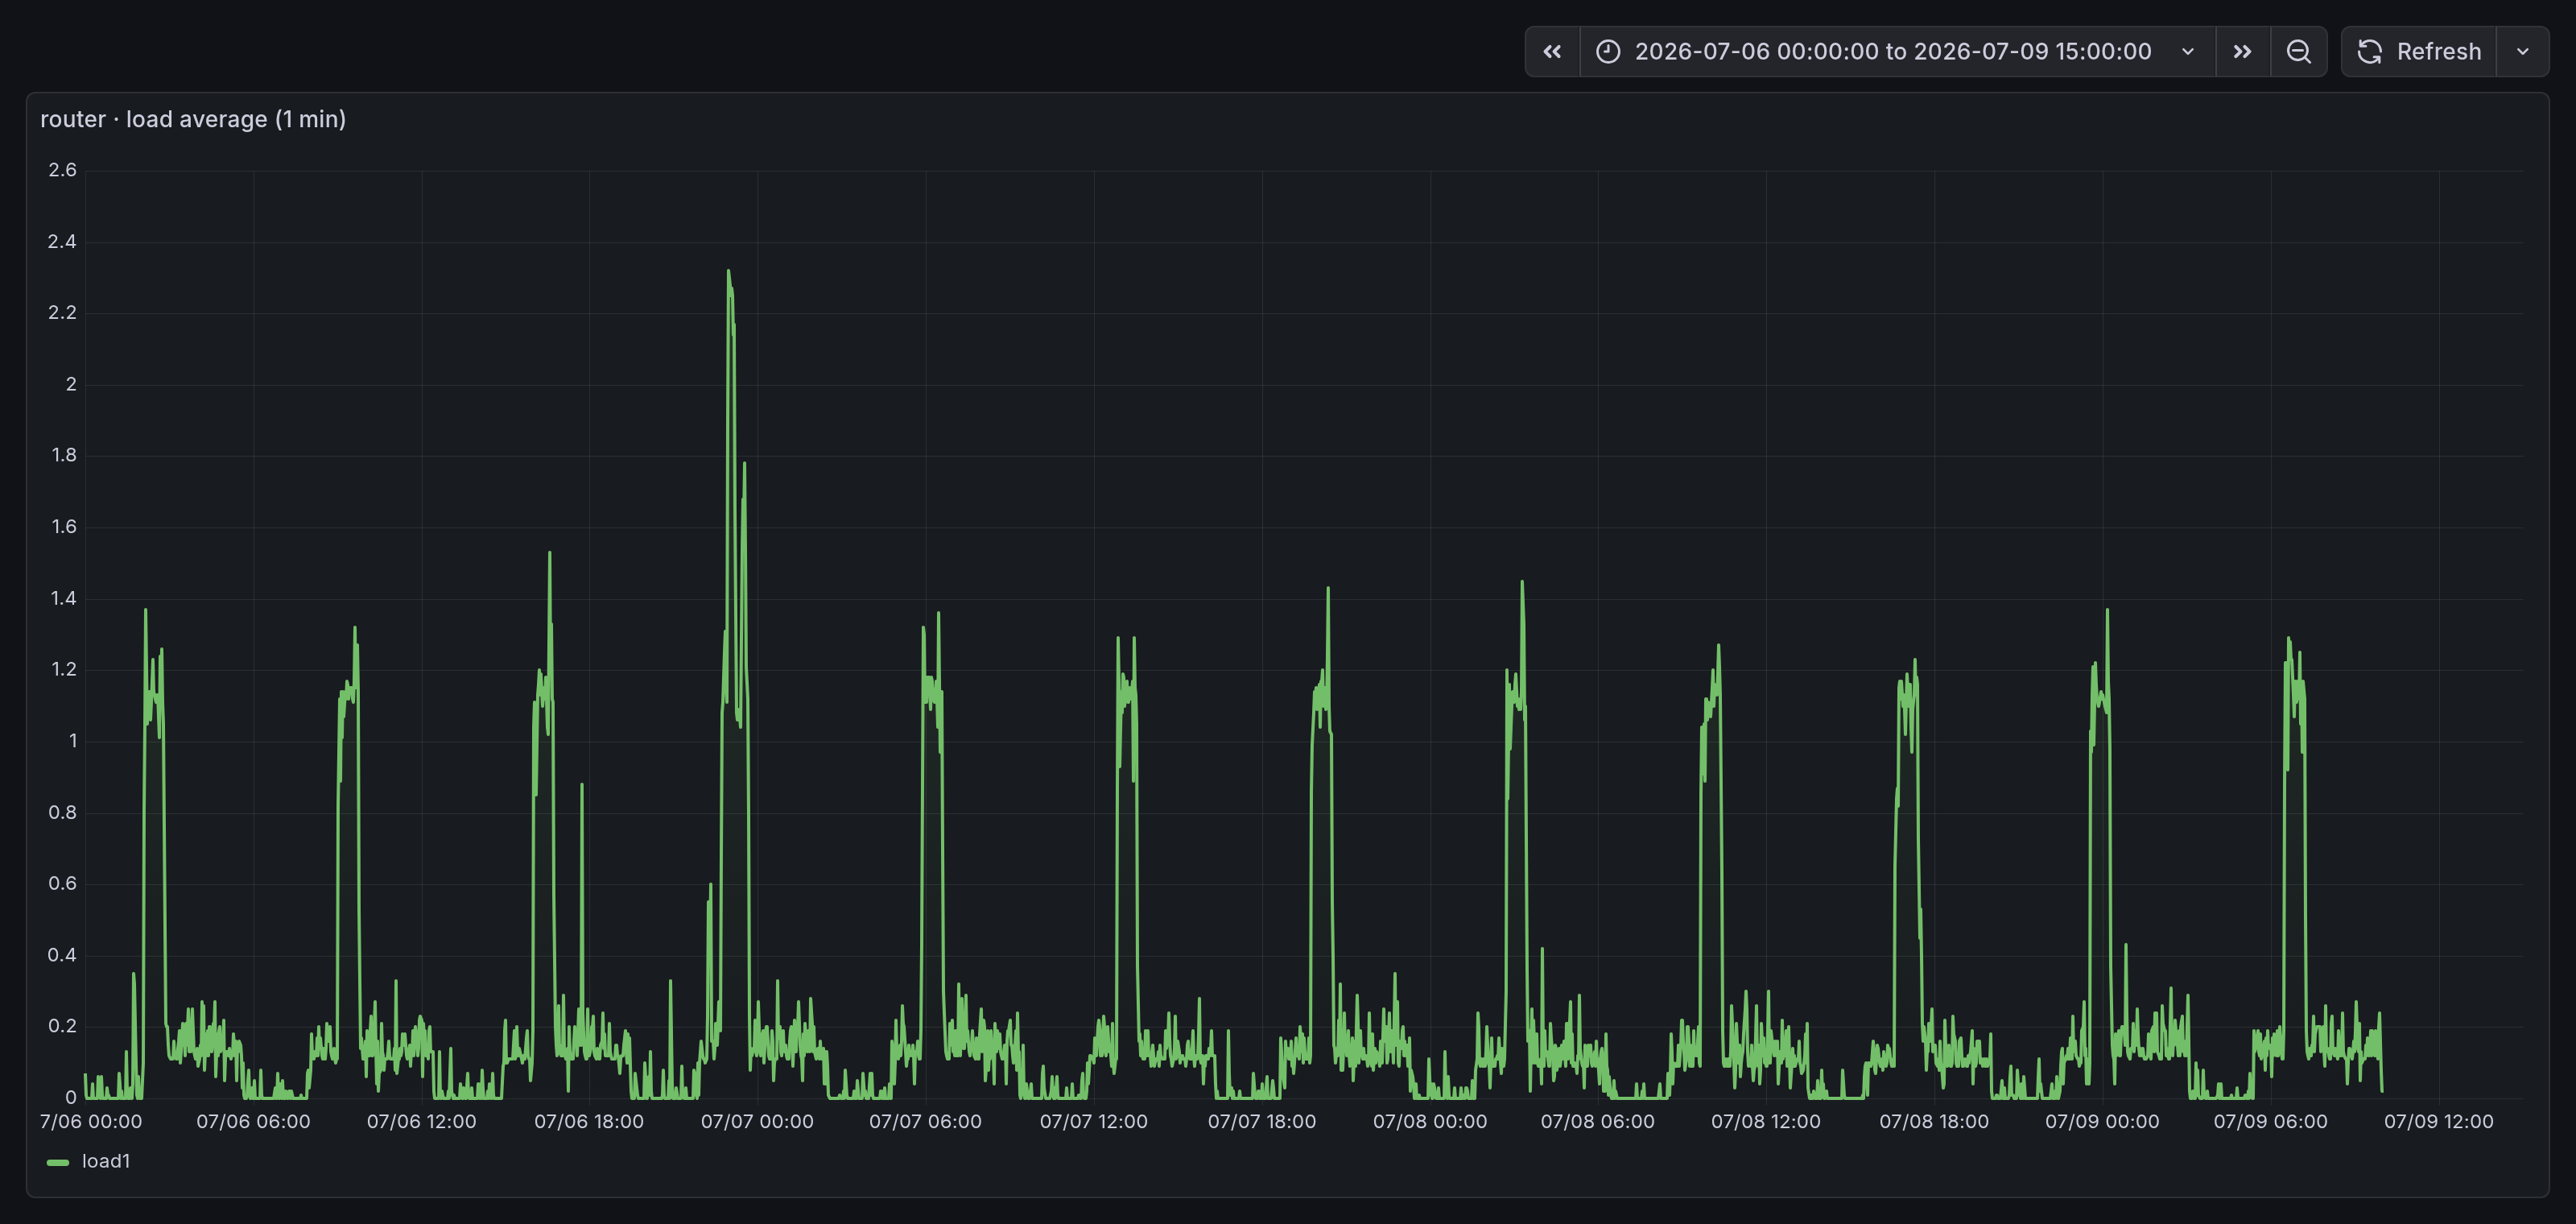
Runnable, blocked, stolen: all zero. The lie is in the measurement.
The kernel takes a survey, not a census
The kernel doesn’t measure load continuously. Every 5.000 seconds (LOAD_FREQ, kernel/sched/loadavg.c) it glances at the run queue and counts heads. Load average is a decaying average of those glances.
Now give some daemon a wake period of 5.001 seconds. Almost always its wake misses the glance and it’s invisible. But the phase slides 1 ms per cycle, and eventually the wake lands on the glance, and keeps landing there, sample after sample. The kernel counts one runnable task at every glance and reports load 1.0. The daemon is doing nothing, at exactly the wrong moment.
sampler period     5.000 s
daemon period      5.001 s
drift              1 ms/cycle
beat period        5 s x (5 s / 1 ms) = 25 000 s = 6 h 56 m
observed           ~6 h 55 m
Mesa width is how long the wake stays within a few ms of the glance. The drift rules out everything cron-shaped in one stroke.
Load average is a survey, not a census
Anything periodic that aliases against the 5 s sampler gets counted every time or never. Load 1.0 can be a busy core or an idle daemon with good timing. The CPU counters know which.
Naming the daemon
I left a tripwire on the router: a transient unit sampling every 20 seconds, logging any runnable or blocked task whenever load passed 0.8. The next mesa arrived on schedule, 19:05 to 19:48. Twenty samples, load around 0.9, and the run queue was empty in every one. Even hunting during the mesa, a process listing finds nobody awake. The contributor exists only at the kernel’s sampling instants, milliseconds wide.
So I traced sched_wakeup for a minute. One family of short-lived processes wakes with a median period of 4.9999 seconds. Fork tracing walked it back: the router’s HTTP API server, execing an op-mode wrapper, forking a burst of a dozen helpers lasting about 15 ms, once per request.
The requests were mine. My monitoring daemon polls the router’s API for interface counters every 5.000 seconds, on a Go ticker. It went live July 5. The mesas start July 6.
The fix is one digit:
// 6s, not 5: a 5.000s tick beats against the kernel's 5s LOAD_FREQ
// run-queue sampling on the router and paints phantom load-1.0
// plateaus every ~7h.
samp.Start(context.Background(), 6*time.Second)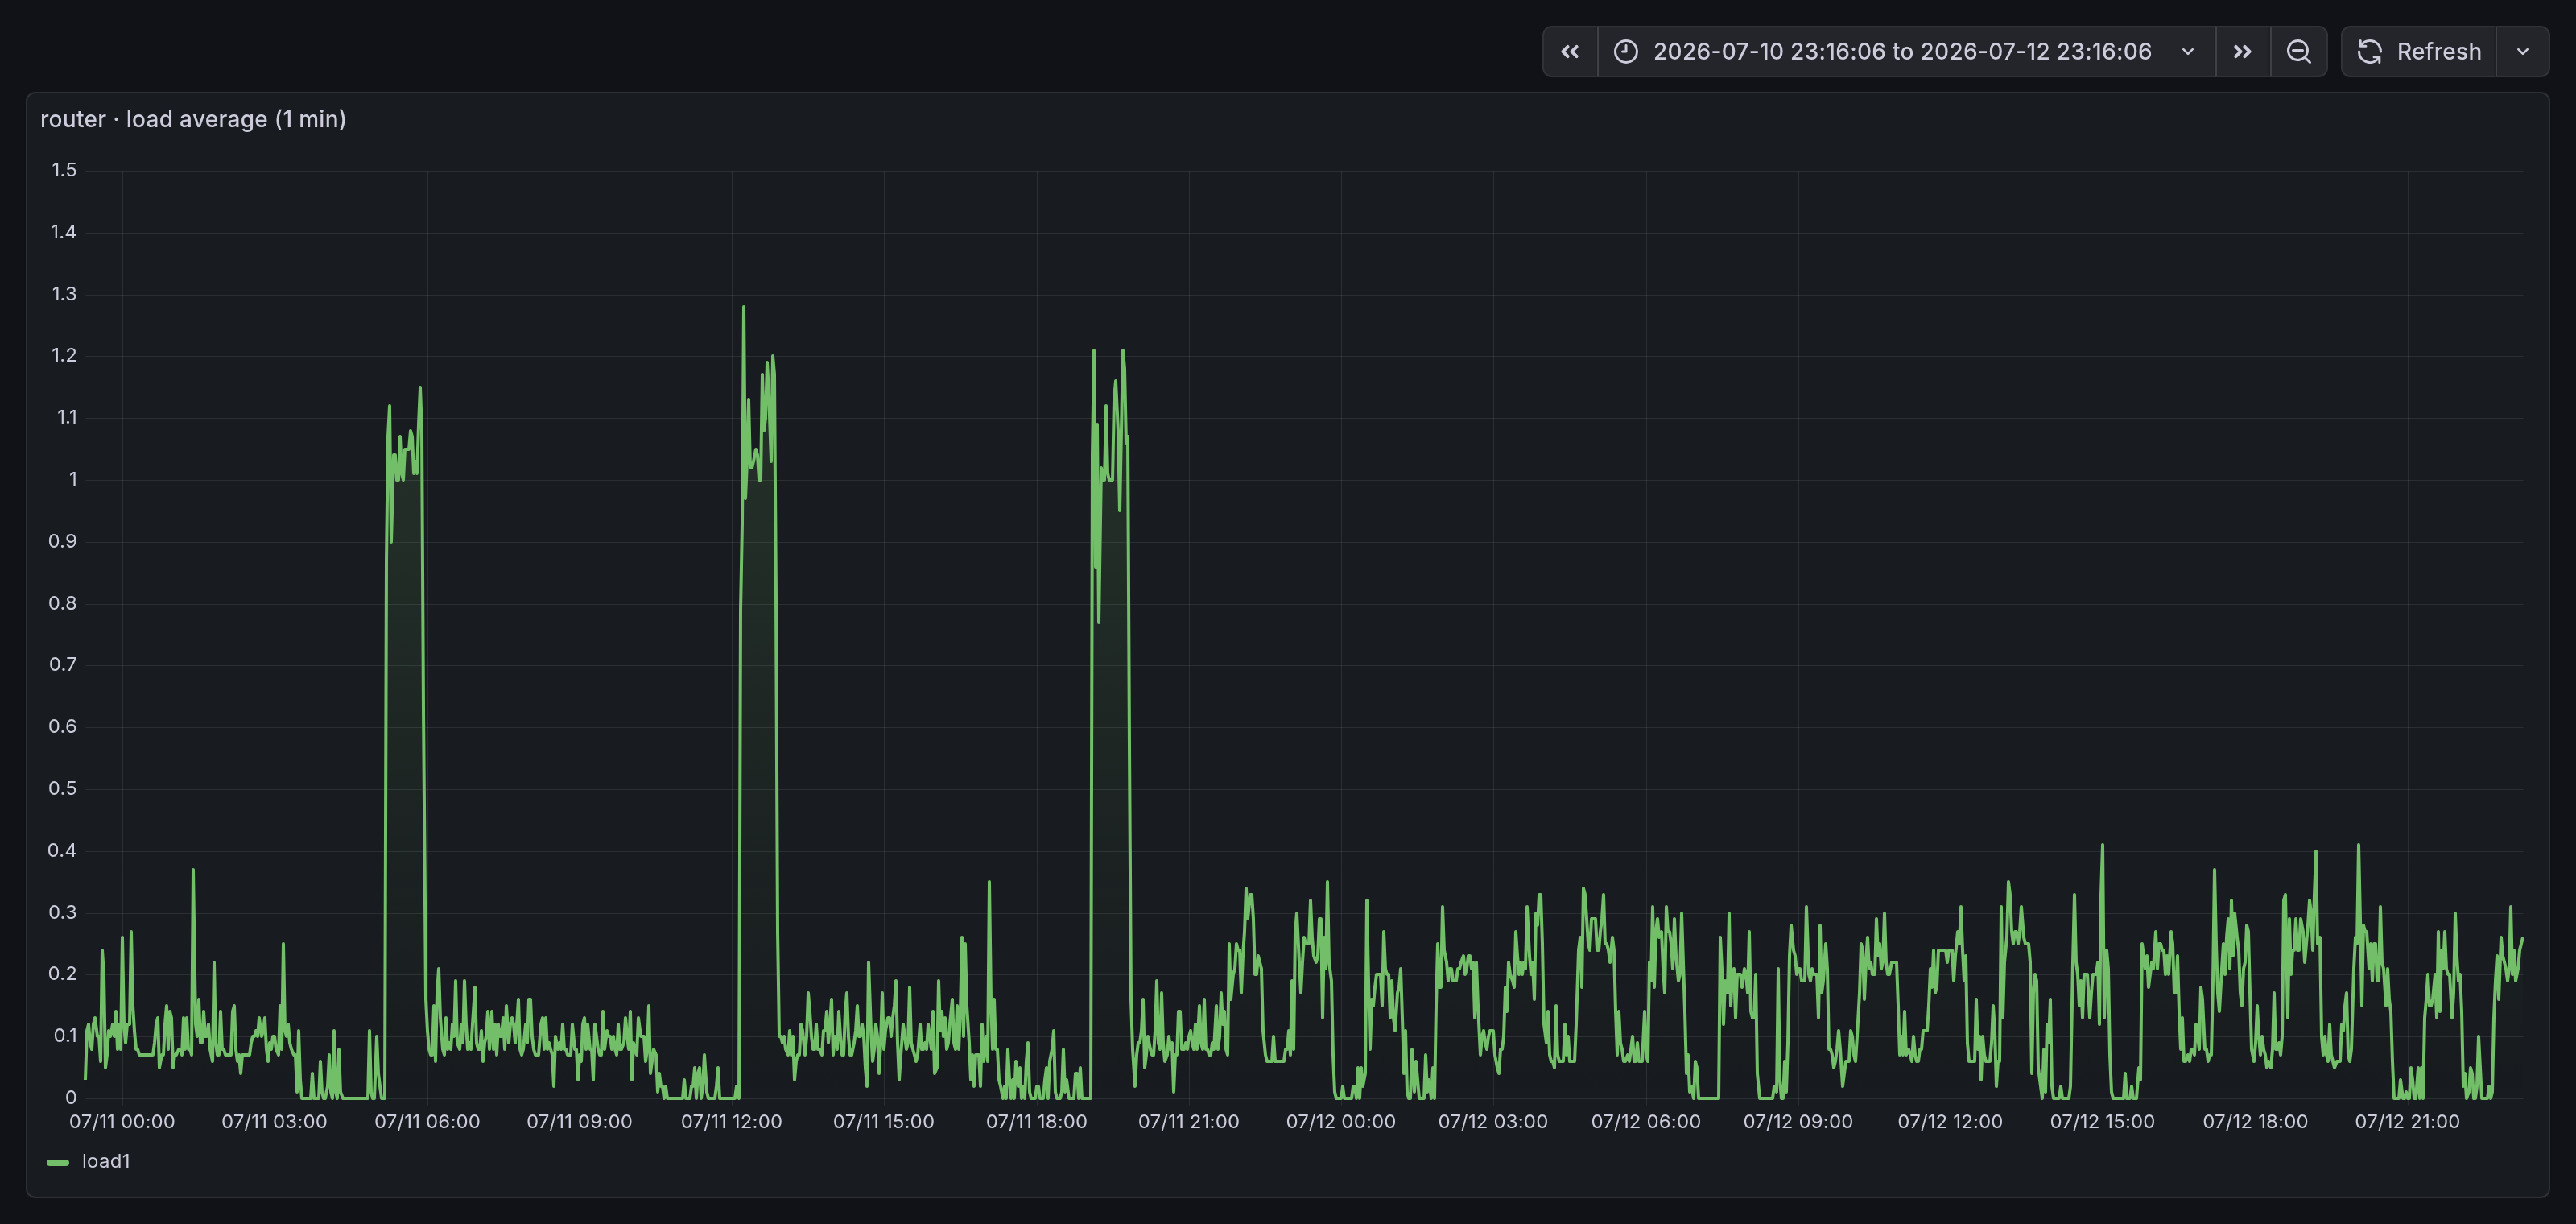
Deployed at 21:45. Four mesa windows have come due since. None showed. The baseline noise is slightly chunkier now, the 6 s tick meeting the 5 s sampler one glance in six instead of every one: the same physics, no longer resonant.
Nothing was ever wrong. The aliasing also runs in reverse: a real periodic load that wakes between glances is invisible to load average. If you alert on load, you’re alerting on a strobe light. Alert on CPU, latency, queue depth: things measured continuously.
Two five second clocks, a millisecond apart, one of them mine.